Is the Premier League really that much more repetitive?

Manchester United’s stream of league titles since the early ’90s has brought with it frequent accusations that the competition has become excessively repetitive. You don’t need an infographic to tell you that only three clubs have won the title in the last 16 seasons, there hasn’t been a new champion since 1978 and a bit of variety would be very welcome – unless you’re a Man Utd fan, of course. Things like repetition, variety or novelty are difficult to show graphically in a simple and intuitive way so I thought long and hard about how best to represent those things for all of the winners English top flight, and I’m quite pleased with what I’ve come up with.
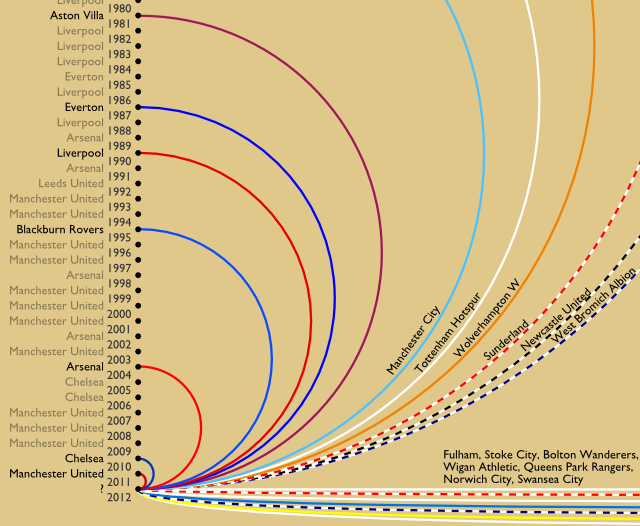
For each champion an arc links the season back to the last time that club won the title. The arcs are all semi-circular so the size of leaps are represented by their width as well as their height. If a club had never won the league before their arc stretches off to infinity i.e. is a straight line that reaches the edge of the image (which, in practice, is not quite infinity pixels wide). In short: large arcs and straight lines show novelty, small arcs show repetition.
I have used seasons between titles as my measure, rather than years between titles. This means that the arcs aren’t widened by the suspensions of the leagues because of the World Wars, something that would have caused an artificially large amount of variety appearing for titles around the wars.
The below image has been cropped slightly (apologies to Blackburn) so it can be comfortably viewed in the blog. Clicking it will open the larger, uncropped version in a new tab.

Here’s a few basic observations, feel free to add your own:
- Blackburn’s title in 1993-94 represents the largest gap between a club’s consecutive titles.
- Although Chelsea’s first Abramovich-backed title seemed like a crushing inevitability following their vast spending, it was in fact the third most novel title in history (aside from first-time champions).
- The recent repetition isn’t a new phenomenon initiated by Man Utd, rather a continuation of the monotony started in the mid ’70s by Liverpool.
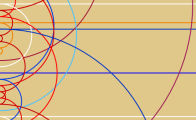
This shows the amount of novelty that would result from each of the 20 teams in next season’s Premier League winning the title:

Keep your internet receivers tuned to this frequency if you’d like to the same treatment applied to other leagues in the future.

[…] I have previously applied this graphical treatment to the English championship and you can read more about the rationale behind the diagram in that post. […]
Love this! Amazing info graphics! We are re-blogging, (credit will be given of course).
[…] ongoalsscored.wordpress.com Share this:TwitterFacebookLike this:LikeBe the first to like this […]
[…] have previously applied this graphical treatment to the English and Scottish championships and you can read more about the rationale behind the diagram in those […]
Great representation. Clearly shows that the past 20 years have been quite dull in terms of variety.
[…] first time I’ve looked at the extent the Premier League has become more monotonous over time…Repetitiveness in league championsThe fortunes of teams promoted to the top […]
[…] of variety in the challengers for and winners of the Premier League. You can see evidence of that here, here and here. When a new champion has come along, like Blackburn, Chelsea or Man City, any […]