The Peter Crouch Myth

 It seems to be widely accepted as fact that Peter Crouch only scores goals for England when faced with weak opposition. Having never felt that this reputation was justified, I have investigated statistically and found startling results that show that he is an incredibly prolific and underrated international centre forward and will change the face of Peter-Crouch-only-scores-against-rubbish-teams-ology forever.
I am going to compare Peter Crouch to his most-capped contemporaries in the England strike force as well as the other major centre forwards from England’s recent past. The line-up, starting with the earliest capped, is Gary Lineker, Alan Shearer, Teddy Sheringham, Michael Owen, Emile Heskey, Wayne Rooney, Peter Crouch, Jermain Defoe and Darren Bent.
Appearance and goal records are up to date for the end of the 2010-11 season – the last match included is the Euro 2012 qualifier against Switzerland on 4th June 2011.
This post uses the ranking based on the World Football Elo Ratings to quantify the quality of international teams. A country’s rank for a particular match is considered to be where they were ranked in the world just before that match began.
I’ll start by having a look at basic scoring rates without considering the quality of opponents.
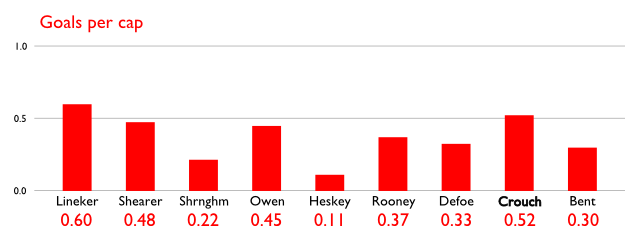
Peter Crouch has a record of over one goal every other game and is second in this list only to Gary Lineker. His record becomes even more impressive when we consider how many minutes Crouch averages on the pitch per England appearance.
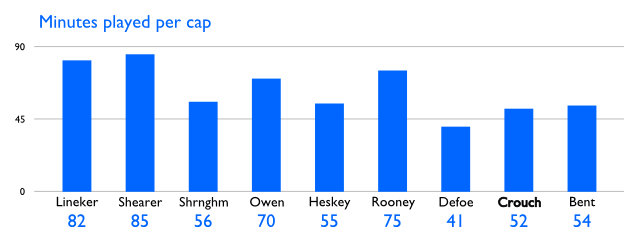
Crouch plays an average of only 52 minutes for every cap he earns. This is lower than all except Defoe and, crucially, half an hour less per match than Lineker, the only player to best him in goals per appearance. Here are revised figures of goals per match, but now a match is defined by 90 minutes of aggregated international playing time:
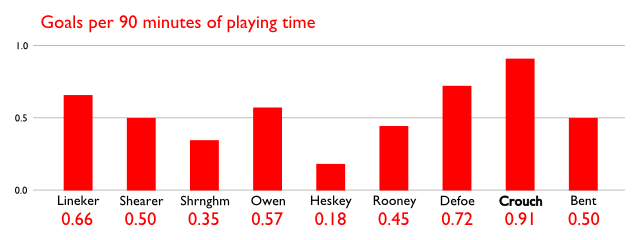
Peter Crouch’s goals per ninety minutes figure of 0.91 is exceptional and significantly better than those of celebrated England strikers Gary Lineker, Alan Shearer, Michael Owen and Wayne Rooney. So what if Crouch’s goals only come against weak teams? Goals against weak teams are valuable; I seem to remember England failing to beat an 80th ranked Macedonia side in qualifying for Euro 2008 – one England goal in that match would have ultimately seen them qualify for the finals. I also recall England failing to beat an 82nd ranked Algeria side at the 2010 World Cup – one England goal in that match would have seen them facing Ghana in the last sixteen instead of Germany.
But remember I said “if Crouch’s goals only come against weak teams”. I don’t think that this is the case, and here’s some number crunching that backs me up:
Below is the mean rank of the opposition that each striker has netted against. The higher the red line the stronger the opponents they tend to score against.
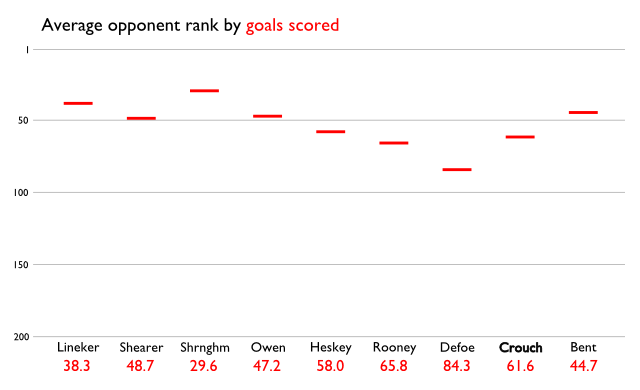
From this it seems that Crouch’s critics have a point. Although far from the weakest, his goals come against weaker opposition than all but Rooney’s and Defoe’s. But before we jump to any conclusions we should really take into account the average quality of opposition that each player has played against. Had a player only ever featured in matches against 232nd ranked Palau we could hardly blame them for only ever finding the net against 232nd ranked Palau. The blue line shows mean opponent rank weighted by minutes played:
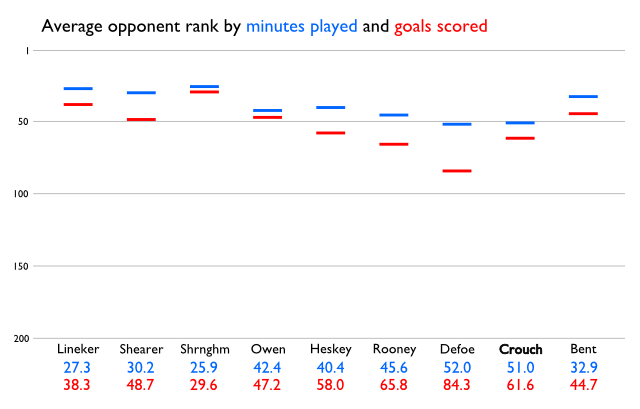
Now the real picture is starting to emerge. The countries that Crouch scores against are admittedly on the weaker side, but the countries that he plays against are also on the weaker side. Only Jermain Defoe is pitted against weaker opposition than Crouch and only by an average ranking position of one. If you choose to take the difference between opponent rank by minutes played and goals scored as your indicator of a quality marksman (i.e. the smaller the distance between the red and blue lines the better) Crouch comes out better than Shearer, Heskey, Rooney, Defoe and Bent.
However, I don’t think simply averaging out the opponent rank of a player’s goals is a very fair measure – and I think that it’s unfair on Peter Crouch. That’s right: I think that Crouch’s record should be seen as even better than the above graph suggests.
Had Peter Crouch not scored the three goals he has scored against Andorra (and I don’t mean scored three goals against Brazil or Spain instead, I mean just not scored them at all) he would have a still very good record of 0.79 goals per 90 minutes but his average opponent ranking for goals scored, instead of 61.6, would be a stunning 43.3 – making him the only player to have scored against a better average quality of opponent than he’s played against. Scoring goals, even against the weakest opposition, should never make your record look worse, only be less of an improvement than if you had scored against stronger opposition.
To get a less constricted picture we could plot goals and games like this:
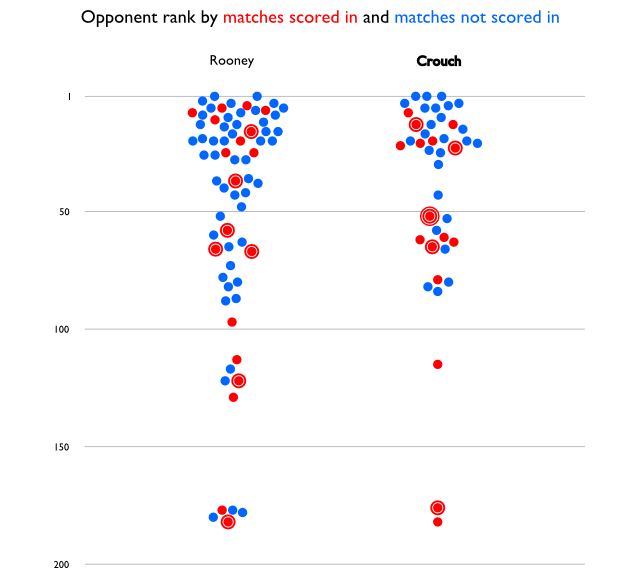
Each dot is a match that the player appeared in. The higher a dot is placed, the better the opponent’s rank (horizontal scattering is random to avoid overlapping). A dot is blue if the player did not score in that match and it is red if the player did score in that match. One or two red rings around a red dot signifies the second and third goal that the player scored in the match.
We can see that Crouch has failed to score in the eight most testing matches he has appeared in: Argentina ranked 6, Portugal 4, Brazil 1, Germany 6, France 4, Germany 5, Spain 1, Brazil 1; the highest he has scored against being 8th ranked Mexico. However, what the graph does not show is that Crouch only played ten minutes or more in three of these matches: he played 9, 55, 7, 7, 45, 2, 45 and 8 minutes respectively. In these eight fixtures he played a total of 178 minutes, so it is fair to say that Crouch has failed to score in 1.98 matches worth of time against the top six teams in the world – not eight matches worth.
Wayne Rooney has played 9 matches and scored 2 goals against teams ranked 6th or higher, playing 76, 61, 90, 62, 90, 45, 58, 90 and 90 minutes for a total of 662 minutes, or 7.35 full matches. Against the world’s top teams Rooney has scored 2 goals in 7.35 matches and Crouch has scored 0 goals in 1.98 matches – inferior, but hardly damning, figures for the Spurs player.
I will next look at the numbers using a fairer, but slightly more complicated, calculation; one that requires rank to be converted into something more practical.
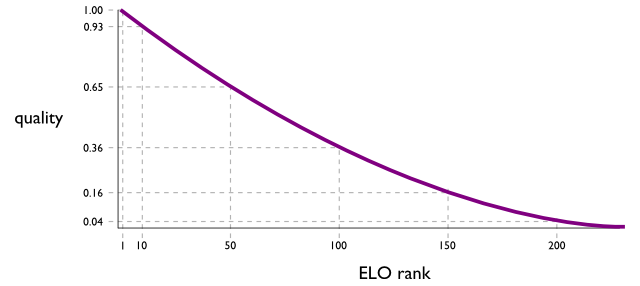
Working with a system where 1 is best and 232 is worst is not very helpful for doing maths so from now on I will be using a converted form of the rankings – that I’m calling simply ‘quality’ – where the top ranked team in the world is worth 1.00 and the bottom is worth close to zero. Ranks are squared as part of the conversion to make the numbers more representative of real gaps in quality. Had I used a linear scale, a goal against 1st ranked Brazil would only worth 3.3 times as much as a goal scored against 176th ranked Andorra; on this scale it is 11 times as much. The latter seems a better weighting by my judgement. This shows how rank and quality relate:
We can now multiply each goal a player has scored by the quality of the opposition it was scored against, add them all up and divide by their total appearances to get a player’s quality goals scored per cap:

A quality goals scored per cap of 1.00 could mean that the player has scored one goal against the best team in the world for every appearance they’ve made. A quality goals scored per cap of 0.25 could mean that they have scored a goal every other game against, on average, sides of quality 0.5.
We also need to take into account the quality of the teams that the player has been playing against. A player can only score quality goals if they get the chance to play against quality teams. For each appearance I multiply the proportion of ninety minutes that the striker in question played (this could be greater than 1 if extra time was played) by the quality of opposition faced. These are also added up and divided by the number of appearance to get a player’s opportunity to score quality goals per cap:

If a player plays 72 minutes per match against teams of 0.8 quality he will have an opportunity to score quality goals per cap of 0.64 (0.8 x 0.8).
Here are the two new measures for each player:
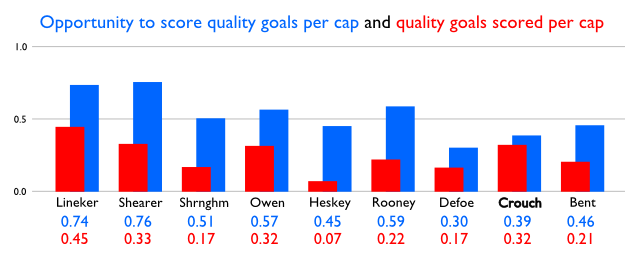 The relatively low quality of Crouch’s goals lets him down here and he falls below Lineker and Shearer if looking solely at quality goals per cap, but his low opportunity to score quality goals per cap comes to his rescue. We can see how much it comes to his rescue by calculating the following:
Which is charted here:
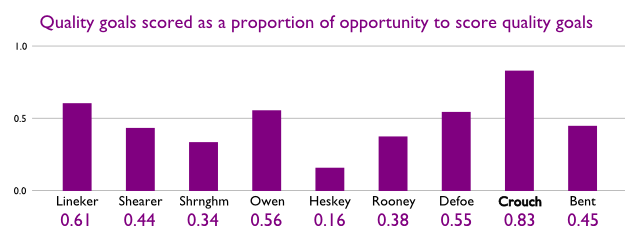
Once the limited nature of his opportunities has been taken into account, Peter Crouch’s excellent goals per minute record sustains being weighted by quality to still be far and away the best of all the players studied. Peter Crouch is the most prolific England striker of the era and his perceived disproportionate reliance on scoring against football’s weak nations is a myth.
References:
World Football Elo Ratings and its primary source, Advanced Satellite Consulting

This looks like it was loads of fun to compile. Great article and unfathomably well-researched.
Thanks. I did enjoy putting it together and it was definitely satisfying to have the stats for the guy I was defending coming out so consistently positive.
Bravo! I’ve been trying to tell people for years about the underrated quality of Peter Crouch (in fact I met my boyfriend at a party when he overheard me say this exact thing in 2006). I’m glad I finally have the (well researched) stats to back up this statement. Next time someone questions the ‘quality’ of Peter’s goals, I’ll write this URL on a piece of paper and throw it at their head.
That’s a great way to have met someone! Whenever I’m at a party and I start talking at length about Peter Crouch people usually start moving to the next room.
Ha ha. I second both comments.
you haven’t factored in ‘importantness’ – perhaps add a factor that represents the occasion? how to measure I’ll leave to your undoubted wisdom, maybe something like place a ranking on the competitions (friendlies, qualifiers, group stage of finals, etc), or (more complicated) proximity to the end of that competition, ‘need’ for the win?
Yes, I was thinking about factoring in other things (giving different weighting for finals matches, qualifiers and friendlies and giving more importance to the winner in a single goal victory rather than the 5th goal in a 5-0 win) but just didn’t get round to it in the end.
Great article but Crouch is fucking shit for the Tottenham and that’s all I care about.
My adjective of choice does begin with ‘b’, but it’s not beautiful. See below.
absolutely beautiful statistics!
A real pleasure to read.
[…] QUOTE OF THE DAY: "It seems to be widely accepted as fact that Peter Crouch only scores goals for England when faced with weak opposition. Having never felt that this reputation was justified, I have investigated statistically and found startling results that show that he is an incredibly prolific and underrated international centre forward and will change the face of Peter-Crouch-only-scores-against-rubbish-teams-ology forever" – random stats geek blog 'on Goals Scored' pulls out differential equations, scatter diagrams and reducing curves to prove that Peter Crouch is, actually, England's best striker. […]
Surely it doen’t matter who the opposition is. The main statistic that really matters is the number of goals scored per minutes on the pitch and Peter Crouch’s strike rate for England is better than anybody’s. I have said for a long time now that I think Peter Crouch is very underrated. He should be allowed the full 90 minutes each time. What chance do you have to get into the game if you are brought on with just 10 minutes to go. Harry Redknapp says that he is also a fan of Crouch, but he also doesn’t always have him in the Tottenham side. Throughout his career with whichever club he has been at, I don’t think Crouch has been given the opportunities he deserves. I think, and he probably does too, that he has been hard done by throughout his career. Maybe its because of his size which makes him look awkward, but for a big man, he has some very deft touches and a good footballer apart from goals he has scored. Also, because of his size, the referees pull him up for fouls committed, which other players would get away with.
Complete twaddle, and easy to prove.
Where for instance is your evidence to support your decision to “Ranks are squared as part of the conversion to make the numbers more representative of real gaps in quality.”? There is none, right? Suppose for sake of argument there were only two teams in International football. They would be ranked 1 & 2, right? And you would rate their quality as 1 and 4 respectively right? AND THIS WOULD BE IRRESPECTIVE OF WHETHER THE TWO TEAMS WERE SPAIN & NETHERLANDS (currently 1st & 2nd) OR SPAIN & PALAU (currently 1st & last). So a team such as Netherlands that (likely) comes out close to even with Spain is rated as the same quality as one such as Pulao which would be thumped by them all the time. If you had used a team’s rating to measure its quality, rather than it’s ranking, it might have been worth taking your article seriously.
What this and the responses thereto demonstrates is that by taking a bunch of numbers that people won’t understand but will probably find authoritative and manipulating them until they support any particular hypothesis you can convince them of anything. I don’t know what trade you ply, but in my experience journalists come second only to politicians in this regard.
he changed the scale you fool, paragraph above the ELO relation graph, “where the top ranked team in the world is worth 1.00 and the bottom is worth close to zero.”
Fine. So in the two team International scenario Netherlands and Palao would both be rated as 0. Or maybe 1/4. (I can’t tell which because needless to say ongoalscored does not define what the transformation is). The point being they would both have the same quality rating on planet ongoalscored, irrespective of whether there were any difference between the two teams’ performance against Spain.
Here’s another way of illustrating the fallacy. On planet ongoalsscored, the top team is deemed to be of a quality of 1.0 / 0.04 = 25 times better than that of the 200th (see his his ‘quality/ELO rank’ graph). Instead of playing football, the match results used to produce the Elo ranking could have been determined by throwing a dice where 1 = home win, 2 = away win and 3-6 = draw (i.e. assuming a fair dice treating all teams as being of equal quality). Using the same maths as before, all teams will have Elo ratings different from each other so you can still produce an Elo ranking, and his ‘study’ will still contend that the top team’s quality is 25 times better than the 200th team. Which is clearly nonsense given that by definition their quality is exactly the same.
There is no evidence to support the decision to convert the numbers in that way, I mention in the post that I have used my own judgement. I admit that using the ratings instead of rankings would have been an improvement, but I still would have liked to convert the numbers to accentuate the differences between teams. For example, Spain have a current rating of 2111 whereas Palau have one of 488, meaning that a goal against Spain is only worth 4.33 times as much as one against Palau, which is not a large enough difference in ‘value’ in my opinion.
I’m not sure why a statistical analysis with some imperfections constitutes more ‘twaddle’ than a statement that is entirely anecdotal, but also delivered authoritatively, of the type that I was offering a counter to.
“I’m not sure why a statistical analysis with some imperfections constitutes more ‘twaddle’ than a statement that is entirely anecdotal, but also delivered authoritatively, of the type that I was offering a counter to.”
Those of us who are fans of MLB in the States have a similar problem with knee jerk reactions like this. Baseball and statistical analysis go hand in hand, and you get many detractors who refuse to “get fooled by number manipulation” because they either a) don’t understand it or b) believe it removes a lot of the magic or mystery from the game. What I’ve found in 10+ years of being a SABR geek, the gnashing and grinding of teeth is done because “experts” have already formed an option, and when a study comes out that’s in opposition to what they consider common sense, it automatically becomes “dumb”. They tend to hold onto this ivory tower of knowledge that they smugly think the common fan can’t access or comprehend without their help.
Statistics is the ultimate bulldozer to this ivory tower, and it helps bring some good objective understanding to compete with a lot of subjective inconsistencies or odl standbys: like Crouch’s skill . Get used to hearing the tired old “Lies, damn lies, and statistics” nonsense when someone disagrees with a study because they completely miss the point or details as you described like above.
Otherwise, fantastic study. Excellent work.
1. I have no opinion on whether Crouch’s goals were scored against weaker opponents or not.
2. I am a great believer in stats, just not made up, baseless ones. When I lived in the States, I was a Phillies season ticket holder and loved the MLB stats. But they were proper stats, not tinkered about with to suit the provider’s subjective opinion.
3. You yourself concede “There is no evidence to support the decision to convert the numbers in that way, I mention in the post that I have used my own judgement. I admit that using the ratings instead of rankings would have been an improvement, but I still would have liked to convert the numbers to accentuate the differences between teams.” So why not just say “I think Crouch’s goals were scored against better quality opposition than people think”, then people would realise it’s just your subjective opinion (and nothing wrong with that), not an objective result?
5. “For example, Spain have a current rating of 2111 whereas Palau have one of 488, meaning that a goal against Spain is only worth 4.33 times as much as one against Palau, which is not a large enough difference in ‘value’ in my opinion”. There you go again. Elo ratings tell you about the probability of one team beating another based on statistical analysis of previous results. They say nothing about a team’s quality, whatever that might be. See http://en.wikipedia.org/wiki/Elo_rating_system for a (relatively) simple explanation.
6. “I’m not sure why a statistical analysis with some imperfections constitutes more ‘twaddle’ than a statement that is entirely anecdotal”. I didn’t say it did, I just said your analysis was twaddle in absolute terms, not relative to anything else. My point is that if its got imperfections, it’s not a statistical study as you are trying to lead people to believe, is it?. Surely you can see that if you are going to interpret Elo in a way it wasn’t intended, using manipulation that is not justified, you might as well just assign the “quality” numbers yourself and not lead people to believe there is some verified science such as Elo behind it?
Have a day off Magpie. =)
1. For the avoidance of doubt, just because, as in this case, someone uses specious, flawed reasoning to support it doesn’t make the initial premise (Crouch’s goals were scored against better quality opposition than people think) is wrong. It just means we are no further forward in establishing its veracity. As I say, I have no opinion on whether Crouch’s goals were scored against weaker opponents or not.
2. This thread was pointed out to me by a friend who smelt a rat but didn’t feel he had the competence to argue with ongoalsscored’s maths. I would have replied privately, but I never like seeing *anyone* having the wool pulled over their eyes by specious, flawed use of statistics so replied publicly. When I have previously done this in the context of journalists and politicians, generally people seem grateful.
3. Nobody seems to have bothered to think about whether it’s me or ongoalsscored who is right, so I am forced to conclude the standard of debate here is sufficiently poor as to render engagement futile. So you will no doubt all be pleased to hear I’ll be having the rest of my life off.
Bye!
My conversion leaves a lot of room for improvement and does not make sense if applied the situations you have described but, in my opinion, it is sufficient for this purpose. The conversion was crude and subjective but I don’t feel that I have misled people to the contrary.
Drawing conclusions from statistics does not necessarily represent a claim to objective correctness. I could have closed my conclusion with “on the basis of the calculations that I have chosen to make” but, in my opinion, that went without saying.
I think using the squaring factor was perfectly valid. As you say in the article, it’s an approximation, but I would think it obvious to anyone accustomed to ‘bell curve’ data that it’s a reasonable one, and likely to be a better reflection of the truth than sticking with the linear rankings.
I recalled a comment made by my Italian (Inter fan) boss during the Champions League final between Liverpool and Milan in 2007 (not 2005 when Liverpool won).
Milan were 2 up and my boss remarked that it was a mystery why Benitez kept Crouch on the bench.
Crouch came on and immediately Milan panicked, allowing him to shoot forcing a great save from Dida(?).
Thereafter Liverpool managed to get one back.
My boss’ opinion is that Peter Crouch is very difficult to handle, due to his height (of course!) but also due to his ungainly but superb ball control.
Nevertheless, his effectiveness against quality opponents would be limited by his playing time – the longer he played in a match, the more confident his markers get. So he would be the best supersub for England and for any club.
Can you do the same for him in the English Premier League? If he had been anything like as prolific we (Spurs) would have had 4th (or third) last season. But he wasn´t and we weren´t.
Ah well…
It’s nice, but there is a small caveat. It’s probably easier to score per minute as a fresh substitute in the final ten minutes of an encounter than it is per-minute for a starting player. A small thought experiment, suppose you played 100 games, and in each game player X plays the full 90 minutes and player Y plays only the final ten minutes. Would you expect player X to score ten times as many goals?
Tecnically it would be 9x more. 😉
that’s a very good point..
Jimmy Crankie could out jump Crouch and Julian Clary could knock him off the ball.
That said , he has quite a bit of skill with his feet for such a tall bloke.
Who cares if they could? It simply doesn’t matter. He still scores goals and a phenomenal rate. This does matter.
[…] […]
It’s important to draw from these impressive, well-designed graphs that Peter Crouch consistantly scores against weaker opposition – a noteable weakness of the England Team. We have a tendancy to draw/lose to opposition seen as an easy game (which leads to the considerable column inches devoted to calling England players showboaters and money-grabbers).
…and if it’s so easy to score lots of goals against weak opposition, why can’t all those other ‘better’ players manage it at anything like the rate that Crouchie can? Could it….dare we say it…be because Crouchie is actually….better?
I’m interested in the technical details relating to the creation of these graphs. Did you do the initial work using R or some other statistical analysis tool and then make them pretty with Illustrator? The stats are very well presented and the graphs have quite a consistent feel to them.
I compile the numbers in a normal spreadsheet then make the graphs “by hand” in Inkscape (a free Illustrator substitute). It isn’t quick but it’s the only way I know to get graphs exactly the way I want them.
[…] http://ongoalsscored.wordpress.com/2011/08/07/the-peter-crouch-myth/ Like this:LikeBe the first to like this post. Posted by butitsmyonlyline Filed in Uncategorized Leave a Comment » […]
I love this because it’s so nerdy! It’s just a bit of fun, can’t believe some of the serious critical comments.
The Australian’s had a chant during the World Cup in Germany “If Peter Crouch can play for England so can I”. You have manufactured a response. However, his goal there should have been disallowed for holding the defender down by his hair.
peter crouch still the best, but unfortunately he doesn`t have some experience in UEFA Champions League
You can do all the number crunching you like on individual players, but one thing that seems to have been overlooked is the fact it is a team game. It does not matter how good you are at scoring goals – if you don’t get the ball, you don’t score, “simples”! Maybe a statistic for the number of chances converted against the number of chances they had based on simple/difficult/whatever would be more accurate.
Look at Darren Bent – couldn’t hit a barn door from 3 feet in many matches – then turns on a sixpence and lashes a beauty in from 18 yards, wins the match and is a hero – but he’s has 25 opportunites during the game! Does that made him a good striker? I read somewhere that Defoe scores 1 goal for every 3 chances he has – which is good in anyones book. In a recent match he did not score, but only had one chance from 18 yards which flew only an inch wide of the post and certainly had the goalie panicing! Does that make him a bad striker?
From the info above, it would seem that Crouch, Defoe and Rooney are the best we currently have – so why do we not try to build a TEAM to supply them rather than keep on trying to decide who is the best and trying every “wannabe england striker” in the league? Young players should come through as and when ready – but one at a time to fit in and not disrupt the overall team play.
That is one thing England have NOT been for many years – a TEAM. Remember – when we won the World Cup Final back in 1966 – arguably our best player did not take part, and his “understudy” went on to score a Hatrick. Geoff Hurst only got his chance (I believe in the Semi-final) because Jimmy Greaves got injured. But we had a good solid team that stayed basically the same throughout, that Geoff Hurst knew and slotted into – and I believe that is why we were able to win the World Cup without our best player on the pitch. Teamwork. We did not experiment all the time – we got a good team and stuck with it.
Today, watching England is like watching a group of headless chickens.They lack leadership and they lack a team mentality – and every match seems to have a completely different bunch of players on the pitch – so we won’t be winning anything anytime soon regardless of who is playing.
I think Peter Crouch should play for England, along-side Jermain Defoe, with Wayne Rooney playing just behind. A bit mad, but with Scott Parker and Steven Gerrard in midfield with a winger causing havoc somewhere (my choice would be Lennon who can switch wings) – all we need is a solid back four. Kyle Walker, Ashley Cole, Rio Fedinand and maybe Cahill. Joe Hart in goal, of course. New young players need to come through, but at a pace that does not disrupt the team. We need a solid block of experience with a controlled influx of new exciting players.
In YOUR opinion, I’m probably talking crap – in MY opinion, I think I’m right – but it just goes to show that football is not about stats – it’s about opinions – and that’s what makes it so brilliant!!
Come on you Spurs!! (if you hadn’t already guessed!)
I agree it’s harder to apply ‘Moneyball’ stats to football than baseball or cricket, because it is a fluid team game, not an ‘individual game played in teams’, but that doesn’t in any way mean that opinions are more accurate predictors of truth than well evaluated stats. It is a common opinion is that Crouch can only score against weak opposition, but the facts show that this is not true.
Nice work, stats all make sense although I would have to agree with Rigsby regarding the necessity to look at chances per goals ratios as much as any other stat when determining Englands best striker. (It hurts as a Gooner to agree with a spud!)
I also need to disagree with Magpie, the use of rangkings rather than ratings is a fairer way to reflect a goals true value, as ongoalsscored points out, Paloau are only 4.33 times poorer than Spain on ratings, whereas tehy are 200 times worse on ratings therefore with ongoalsscored’s method, a goal against Spain would be 200 times more valueable than one against Palau which is always going to make sense. We have all seen Hollands 11-0 win against san Marino for example, and therefore could not argue with a goal against Holland being worth a lot more than 3 to 4 times more than one against San Marino.
Finally, Magpie’s hypothosis about IF there was only 2 temas in the ranking simply does not stand up because there isn’t only 2 teams, there are 200 odd. If there was only 2 temas then fine, but as there are over 200 basing the calculations on a 1 to 0 ratio with 0.005 per team difference per rating seems the best way to look at the true value of each goal.
Again, nice work ongoalsscored, I nearly never comment on these blogs but Magpie’s comments just seemed so unfair and actually incorrect that I could not help myself.
Wow! Magpie really likes to show off about how many big, impressive words he/she knows.
Maybe I missed something, but I didn’t see anything that said “This is the one, and only, correct answer. Everything else is either incorrect or a lie” anywhere in the article. As far as I’m concerned, as a reasonably well-educated professional (although not by any means a statistical mathematician), this is a well argued case for Crouch’s true worth on a football pitch.
The problem with any kind of statistical analysis is that statistics alone do not tell the whole story. There are so many different elements in any kind of sport that come into play, for example:
– Emotion (e.g. derby matches, matches against a players’ boyhood/former club etc.), pressure (e.g. 94th minute penalty to win the match that wins the league)
– Previous form (e.g. an incredible scoring run/dought)
– Personal life (e.g. sleeping with a prostitute and realising that a news story about it is going to hit the papers during a major international tournament. Not mentioning any names, Wayne).
How do you quantify factors like this, and work them into an equation? You just can’t! Maybe there are one or two discrepancies in the calculations, e.g. the “value” difference between the Netherlands and Palau, but this arguement comes a lot closer to the truth than an overpaid journalist’s opinion ever will.
Good job mate!
What an empty life.
If Peter Crouch gets picked as a result of this it’ll all be worth it 😀
at last someone who can see the wood for the trees! i have always said this. lineker was amazing! but rooney is poor based on minutes vs goals. crouch was alot more accurate. there are stats that show his accuracy. ie when he takes a shot he is more likely to force a save than most if not all other england players. also as you have proved he is more likely to score when allowed on the pitch
[…] against Egypt… Although on the topic of Crouch for England you should really read this piece: The Peter Crouch Myth by Liam Ferry) Limbs everywhere! (and Rigobert […]
Very very interesting! I have wondered for ages (as an LFC fan) why we got rid of a striker who I believe was our top goalscorer per minute played in his last full season with us, and have since replaced him with ever more inept and overpriced non-strikers. I was overjoyed when we offloaded Torres, but the price we paid for Carroll would have been hilarious if it wasn’t so tragic!
Peter crouch forces the team to play the long ball.
We know the only way to progress as a team is enforcing passing it on the deck style football like Barca.
Hence why crouch is now at Stoke (Wimbledon Style Footy)
Crouch has shown numerous times that he has got great technical ability and it has been noted and discussed by several pundits.
It’s more to do with the managers he plays under taking advantage of his height and using the long ball, I’m not saying he could play in a team that plays Barca level football but he would do a decent enough job in a team attempting that playing style.
This assertion doesn’t seem to be supported by the facts. As shown by the article, whenever England play without Crouch (which presumably means not playing the long ball) not a single other striker can match his record. Ergo, whatever England is doing when Crouch is on the pitch (long ball or no long ball) they could do a lot worse than to do a bit more of it.
Reblogged this on View from the South Stand and commented:
In the light of Peter Crouch’s exclusion from the England squad for Euro 2012 announced today it seemed poignant to reblog this excellent piece of analysis (which was not written by a Stoke fan, incidentally).
If Crouch had been the sub and not Heskey at the WC! what might have been, we will never know.
I am a fan and think that a Tall Ctr Forward is a good option in the box especially one that scores goals!!
I have always considered Crouch to have a great touch for a tall man and I completely agree with the above analysis concerning his international career. However, his domestic form lets him down. At Stoke this year he only scored 10 goals in 2813 minutes of Premier League football – about 1 goal every 3 games. Compare to the 14 goals in 1616 minutes of PL football for Edin Dzeko (similar in styles) – about 1 goal every 1.3 games – and he was thought to have a fairly indifferent season. Maybe he is better in the England set up because he is utilized more efficiently or maybe he has just got lucky (he has just hit a purple patch for England). I think he has got to be a better option than Andy Carroll though which is not saying much.
The plain fact is he is not seen as “cool” enough by the powers that be or the press. Even though he does have an amazing record per minutes on pitch, he has scored surprisigly few headers for one of the tallest international players. Just think how good he could be with some decent bloody service for a change! Unfortunately, I fear he will never be given the chance of a sustained run jin the team as it appears the only place his face fits is on his head! Shame on you, England set up and press.
[…] fall by the wayside, and Peter Crouch inexplicably fail to remain in contention despite an almost unprecedented goalscoring record for the Three Lions. Theo Walcott’s sublime hat-trick against Croatia was not enough to warrant him being played […]
Hi, I think your site might be having browser compatibility issues.
When I look at your blog site in Safari, it looks fine but when opening
in Internet Explorer, it has some overlapping.
I just wanted to give you a quick heads up! Other then that, excellent blog!
Thanks for letting me know, Stella.
I’ve had a look around in IE but I can’t see anything significantly wrong. Could you tell me the version of IE you used and what the problem was in paricular? Cheers.
Quality essay. Thanks for taking the time to do this.
Enjoyed the article – as a Stoke supporter we love Crouchie, but at the risk of further complicating the arithmetic: if Crouch is playing only about 10 mins in a lot of his games, then he is probably coming on late as an impact sub with fresh legs against an opposition who have mostly played 80 mins or so already, whereas Shearer etc will mostly be playing from the off, so could their prepensity to score decrease with fatigue as the game goes on? Is there a way to factor that in – propensity/opportunity to score weighted by time played/fatigue factor? Does anyone really care? Fun article anyway.
I have argued Peter Crouch’s case for years and always threatened to write to a journalist to ask the question “how many minutes has he played for England”. Now at age 76 I’m able to ask Google ( now I have a laptop) and get to your brilliant contribution which has me punching the air in justification. It should also be noted how valuable he is when the opposition is awarded a corner or free kick. His height has been very valuable helping out in defence. And how many chances has he provided for his colleagues, winning the header and either laying the ball off or placing the ball for another team mate to strike. Yes, the knockers have done an excellent job in destroying the international chances for Crouch, they should hang their heads in shame, but well done you for this excellent article.
I liked this analysis, great work, but I’d like to suggest two other factors. One is criticality of the game, which I know the author is already looking at. The other is to look at predicted goals conceded per game by the opposition based in an average adjusted for a similar opponent rank as the team of the goal scorer. This approximates how many chances should occur for every 90 minutes played, which can be multiplied by the percentage of each game actually played by that forward.
I liked this analysis, great work, but I’d like to suggest two other factors. One is criticality of the game, which I know the author is already looking at. The other is to look at predicted goals conceded per game by the opposition based in an average adjusted for a similar opponent rank as the team of the goal scorer. This estimates goals that should be conceded per game and therefore how well the forward is actually doing. This approximates how many chances should occur for every 90 minutes played, which can be multiplied by the percentage of each game actually played by that forward.
Another factor is comparative. If all the other players score few goals per game, then a greater expectation is on the striker to stick away chances. It might only be necessary to examine two or three other top scorers. If this group of say three, includes another top scorer at the time played, youd expect less opportunities calculated from goals conceded adjusted for rank of opposition, by the opponent, to be available for your target forward because others are getting the goals and goal scoring positions so if the ratio of goals scored by the other three top scoring players per minute is low, then at that time your forward needs to score more because presumably they are creating you lots of chances.
If youre playing next to another top forward the percentage of expected goals per 100 minutes, rank adjusted, would go down. If you hit that expected goal ratio that is an achievement and the stats will show this based on expected goals scored against adjusted ranked opposition concession rate per unit of time vs what is actually scored, and this shows how well the player is actually doing.
Assists given could also be added to the goals scored as a fraction I.e 33% of a goal or maybe 50% of one.
Assists recieved in goal scoring positions maybe useful to know but as many forwards make their own luck and goals this isn’t a strong measure. Assists given rather than recieved is most important, and expected goals I.e from assists is already calculated.
So we need to know how many goals the opponent in each case is expected to concede to a team of your rank, and make another adjustment based on goal scoring potential of the players around your striker you are analysing. If this is high the expected fraction of goals scored by a forward of those expected to be conceeded by the opponent, will be lower. How much the forward goes above or below that calculated expectation determines how good they are at scoring goals. So if a forward is placed up front as the main target he SHOULD score more. If he is played with other strikers he should score less.
So this brings in additional variables to show if goal scoring rate in each game is high. Different players can be compared based on this.
An additional variable can be applied as a weighting of minutes played at the end of a game as a substitute and what that is expected to do to minutes per goal.
Been trying to convince mates that crouch is one of the best goal scorers .brilliant piece of statistics .thanks
[…] champions. A great website that I wish was still updated as frequently as it once was. The post on The Peter Crouch Myth is a particular […]
[…] panache). A great website that I wish was still updated as frequently as it once was. The post on The Peter Crouch Myth is a particular […]
[…] shows that he is not. There are even stats to highlight more efficient strikers than Rooney. See https://ongoalsscored.com/2011/08/07/the-peter-crouch-myth/ Could you even imagine debating whether Stanley Matthews or Sir Bobby Charlton were England […]
Just comparing Rooney and lineker and lineker is a much better striker than Rooney
The point that everyone seems to be missing is, he scores against the opposition!! How can anyone criticise his ‘lack of goals’ against Brazil or Germany or Spain if he doesn’t even play?!?! Matt Le Tissier & Glenn Hoddle were treated in a similar way by the England set-up as they were viewed as ‘luxury’ players who weren’t involved enough (though both could change a game with a single kick!) England will never get anywhere near a World Cup win again because the powers that be are influenced waaay too much by the ‘money-men’ who run football now. It’s nothing to do with sport now & everything to do with profit. THAT’S why Crouch was never given a sustained run in the England squad, he doesn’t fit the ‘brief’ for the businessmen pulling the strings, irrespective of his obvious scoring stats, his face just doesn’t ‘fit’
A wooden stick in a round hole.