Everton just hate starting over

 If there’s one certainty about the Premier League that’s more acknowledged than the fact that Everton finish seasons better than they start them, it’s that they start them worse than they finish them.
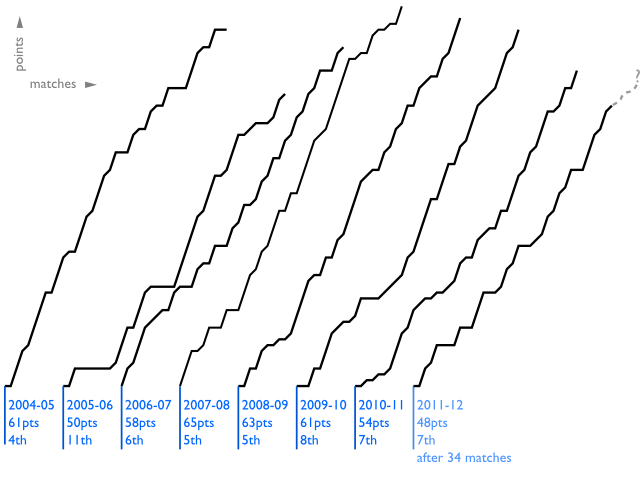
These lines show the progression of David Moyes’ side’s points total in the last seven seasons (including 2011-12 so far). Points are plotted vertically and league matches played are plotted horizontally.
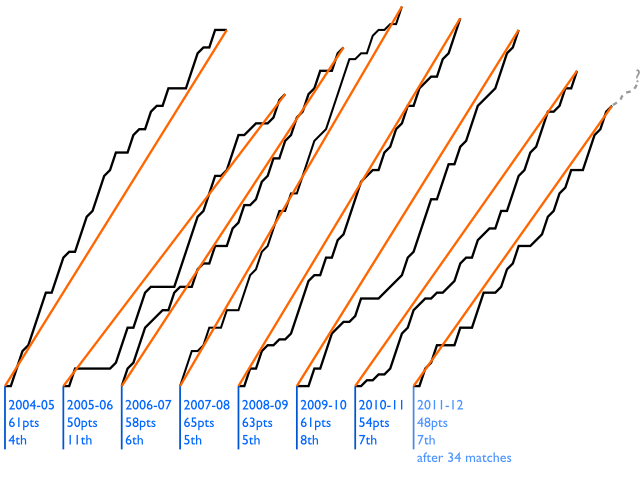
 If a straight line is drawn from the start of each season’s accumulation to its end, we get the following:
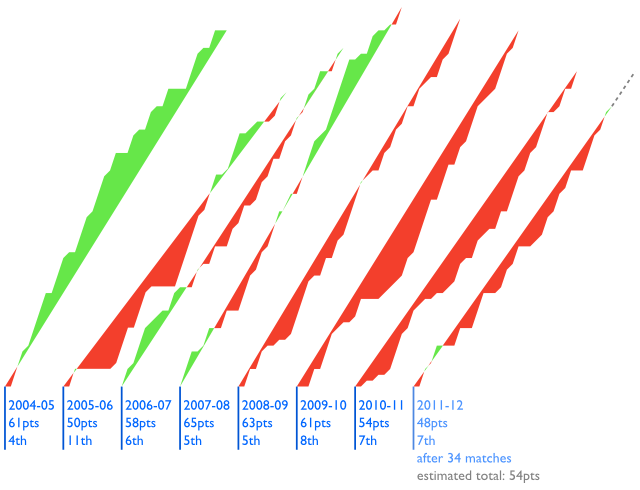
 A series of areas are formed, bound by the black and orange lines. If we fill green the areas where Everton had over-performed (where they had won more points per match than their eventual season average) and fill red the areas where they had under-performed (where they had won fewer points per match than their eventual season average), we get the following:
 You might expect, for the average season, alternating green and red sections, where the side’s results vary between good and bad periods, and this is the case for Everton in 2006/07 and 2007/08.
The last four seasons, however, have been overwhelmingly red with only four green spots – two tiny periods at the start of the current campaign (when they won 7 points in their first 4 matches), another near the closing stages of this season (although the 2011-12 profile is subject to change depending on how they do in their last four matches) and a miniscule one in the middle of 2008-09. So, yes, Everton have, in recent years, started seasons considerably worse than they have concluded them and have spent the vast majority of their time coming from behind in the table. They also had a dreadful start in 2005-06. The last season where they were overwhelmingly in the green was 2004-05, when they beat Liverpool to 4th place.
Much like the chewing of the confectionery from which the Toffees take their nickname, an Everton season is tough and laborious at first, before easing up and becoming more pleasant as it goes on.
David Moyes’ face kindly reproduced by Kay.

Ace!
[…] An illuminating piece on the recent history of Everton, the team that repeats itself year after year. // On Goals Scored […]
Just like Moyes’s side consistency, I struggled a bit getting hold of the analysis at first but then it came clear and it’s a good one. My suggestion: why not draw some partial lines (i.e. quite flat for the first games in 05-06 but steeply ascending for the positive streak that followed) in order to visually associate the slope with performance in each period. That could mantain the impression on the weak performance in early-to-mid-season in 09-10 but also highlight where the rally took place (as can be seen now by the thinning of the red zones).
Yeah, that’s something that could be interesting but it would be up to my own judgement on where to make the split each time I divided a season. I prefer to present the data in a uniform way and allow any trends or patterns to reveal themselves.